
Explosive Move Indicator
Identify Explosive Candles Effortlessly
- Home
- Explosive Move Indicator
Other Service
More Information
Unlock precision trading with the Explosive Move Indicator – a 100% FREE TradingView tool for Demand Supply traders. Spot explosive candles effortlessly on your charts and trade with confidence like never before!

Identify Explosive Candles Effortlessly
Get Started Today and Transform Your Trading Experience
The Explosive Move Indicator is a 100% free tool designed specifically for TradingView users. As a Demand Supply trader, identifying explosive candles is crucial to pinpointing strong letouts in the market. This indicator simplifies your trading process by highlighting these candles directly on your chart, enabling you to make informed trading decisions with confidence and precision.
Built by experienced traders for traders, the Explosive Move Indicator leverages the principles of Demand and Supply Trading to offer unparalleled insights into market behavior. Whether you are a beginner or an advanced trader, this tool integrates seamlessly into your trading strategy, helping you stay ahead of the market.
Why Choose the Demand Supply Zone Indicator?
Applicable to any market available on TradingView, including stocks, forex, commodities, and cryptocurrencies.
Tailored specifically for demand supply traders, this tool is designed to identify the explosive candles critical for strong letouts. Best of all, it’s 100% free, with no hidden charges, subscriptions, or upgrades—giving you access to professional-grade tools at absolutely no cost. The indicator is easy to integrate, fully compatible with TradingView, and seamlessly fits into your existing workflow. Developed with proven trading methodologies, it delivers accurate and reliable results, ensuring consistent performance. Its user-friendly interface, with an intuitive design and easy-to-understand output, makes it accessible for traders of all experience levels.
Enhanced Market Analysis
Identify explosive moves effortlessly, reducing guesswork and improving trade accuracy.
Save Time
Focus only on key areas, minimizing the time spent analyzing and identifying explosive candles manually on charts.
Versatile Application
Useful across multiple asset classes including Stocks, Commodities, Forex, and more.
Strategic Insights
Strengthens your understanding of market dynamics by visually presenting explosive moves for demand and supply scenarios.
Seamless Integration
Add it to your TradingView charts with just a few clicks.
Customizable
Allowing you to adjust the candle color to fit your preferences.
Step-by-Step Tutorial to Add the Explosive Move Indicator to Your TradingView Charts
Before you begin, ensure you are logged into your TradingView account to save the indicator and use it on your charts: LOGIN
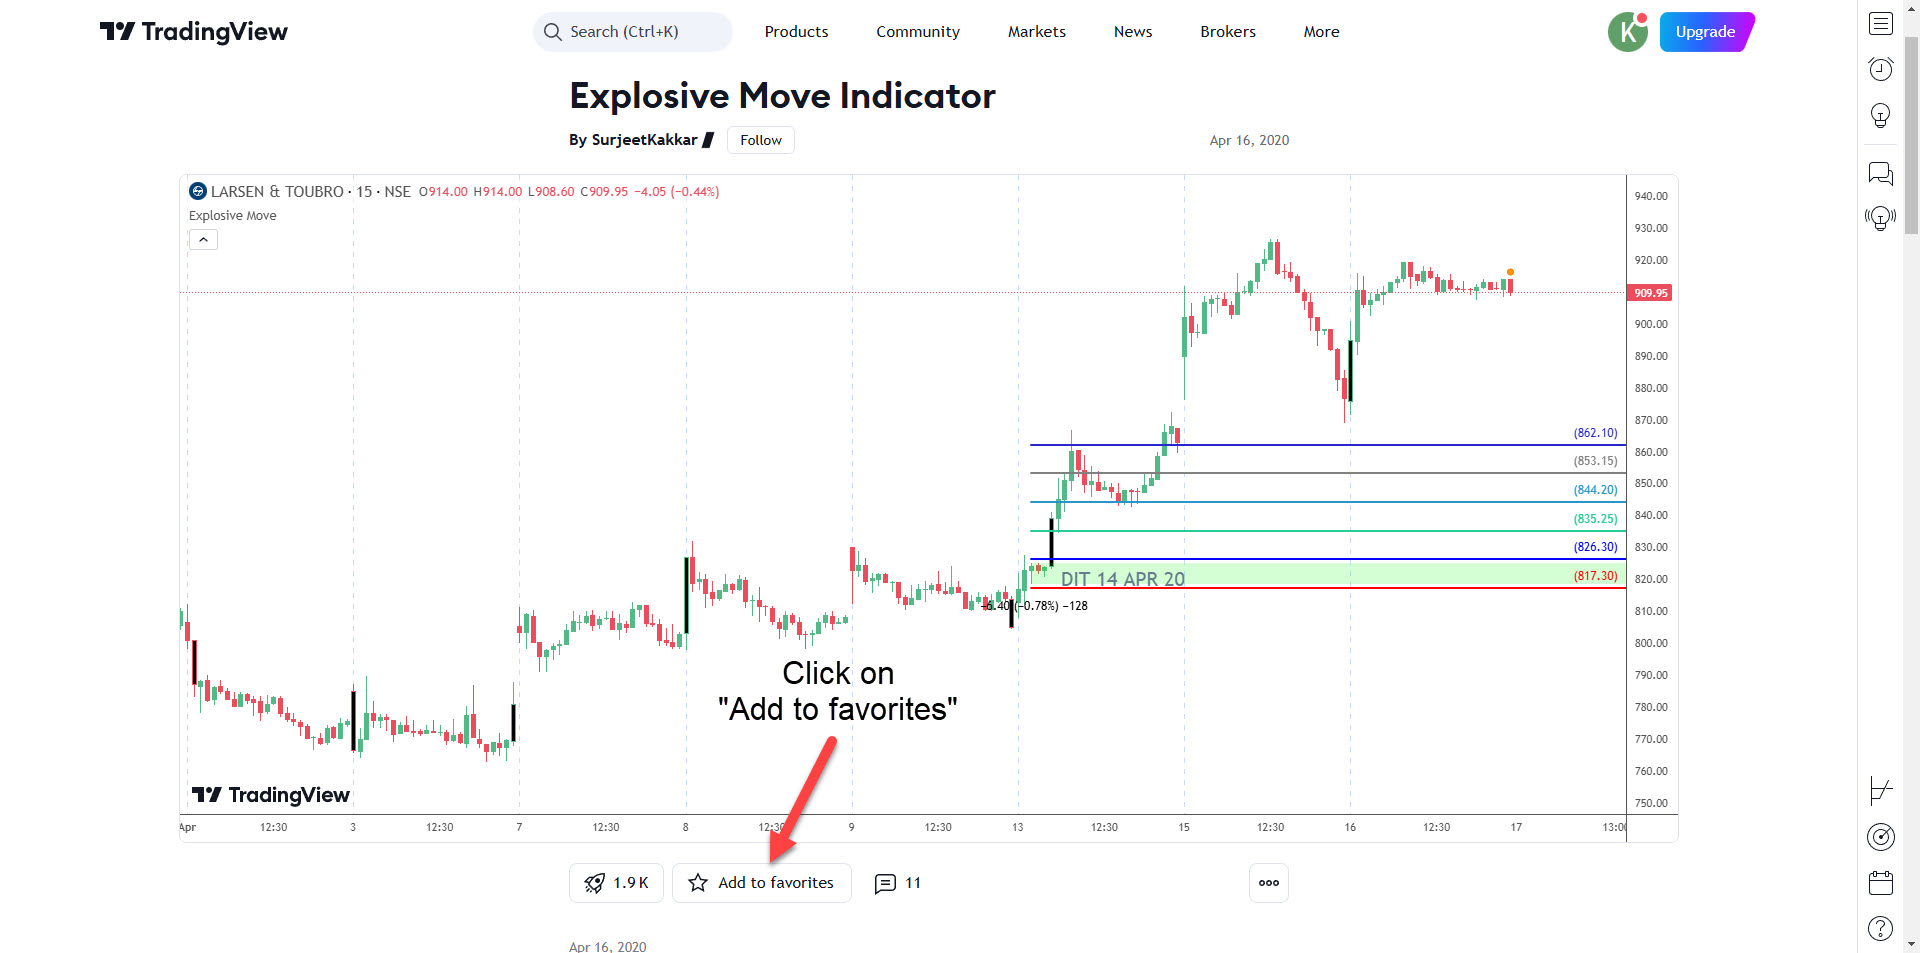
Step 1: Access the Explosive Move Indicator Page
- CLICK HERE to visit the Explosive Move Indicator page on TradingView.
- Scroll down the page to find the “Add to Favorite” button.
- Click on “Add to Favorite” to save the Explosive Move indicator to your TradingView account.
Step 2: Open TradingView Charts (Candlestick Chart)
- Open the chart where you want to apply the indicator.
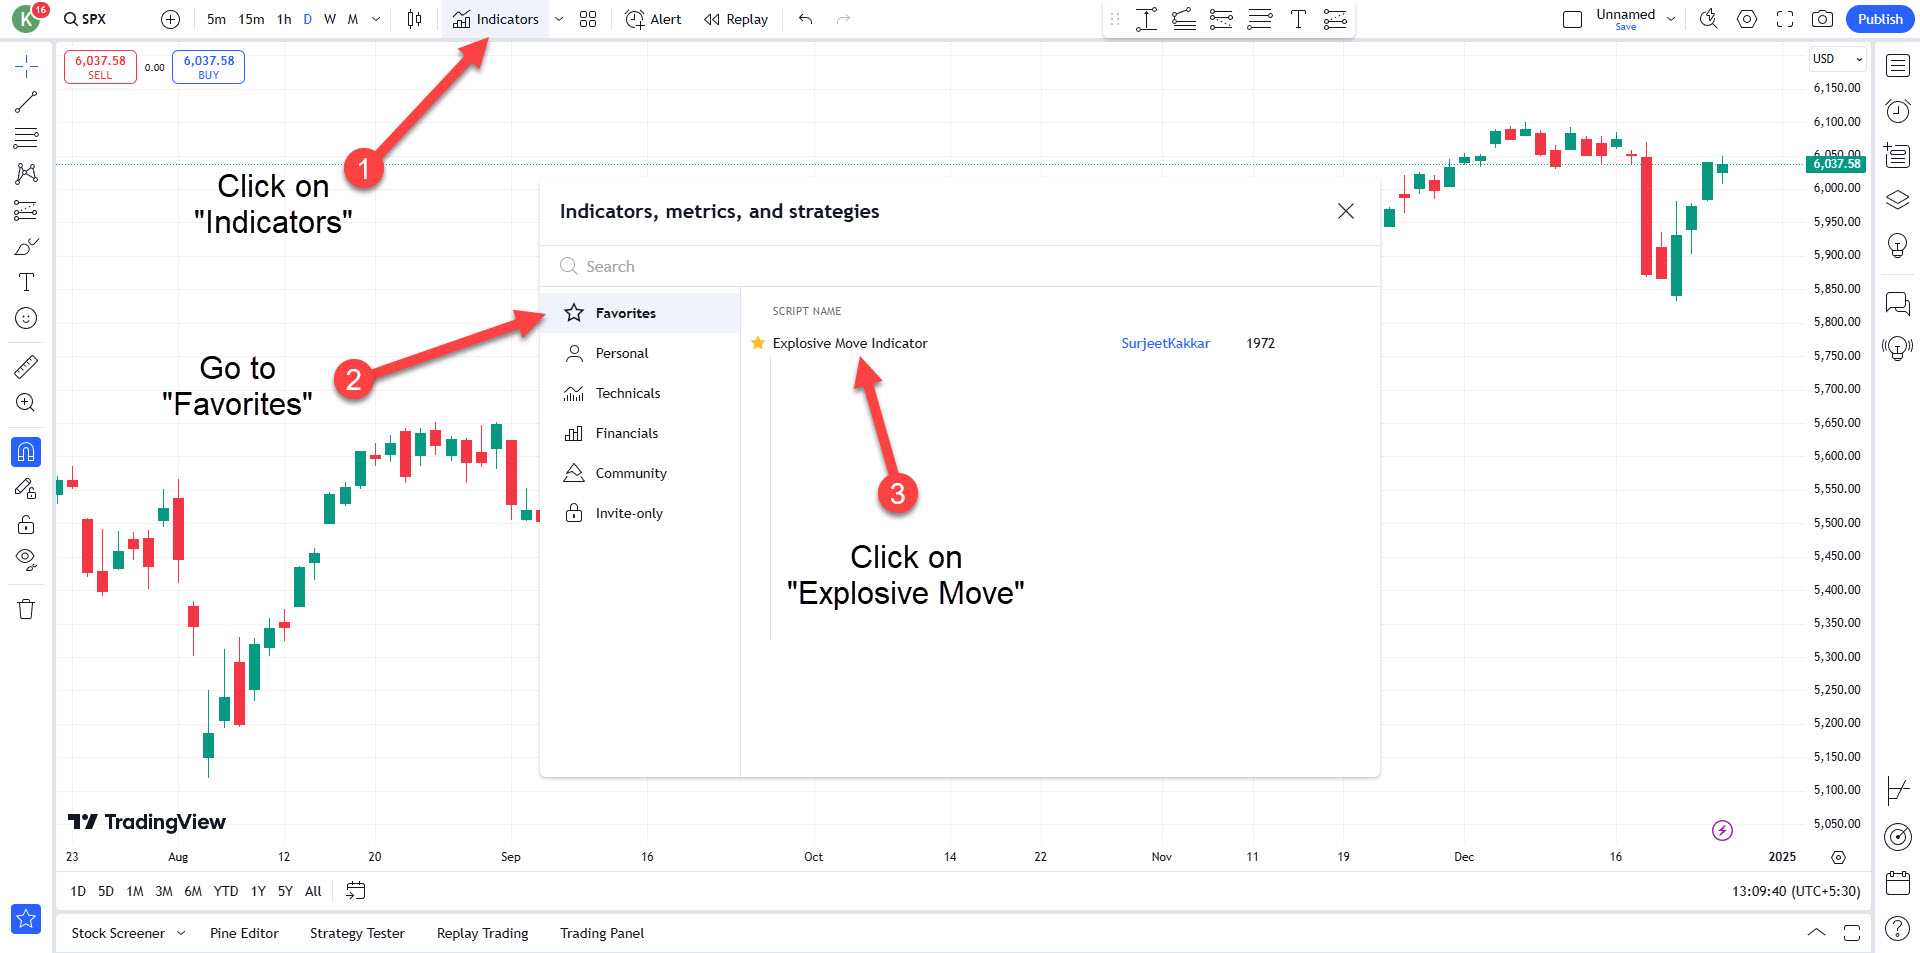
Step 3: Add the Explosive Move Indicator to Your Chart
- Click on the “Indicators” button at the top of the chart window.
- In the Indicators menu, go to the Favorites tab.
- You should see the Explosive Move Indicator listed there.
- Click on it to add the indicator to your chart.
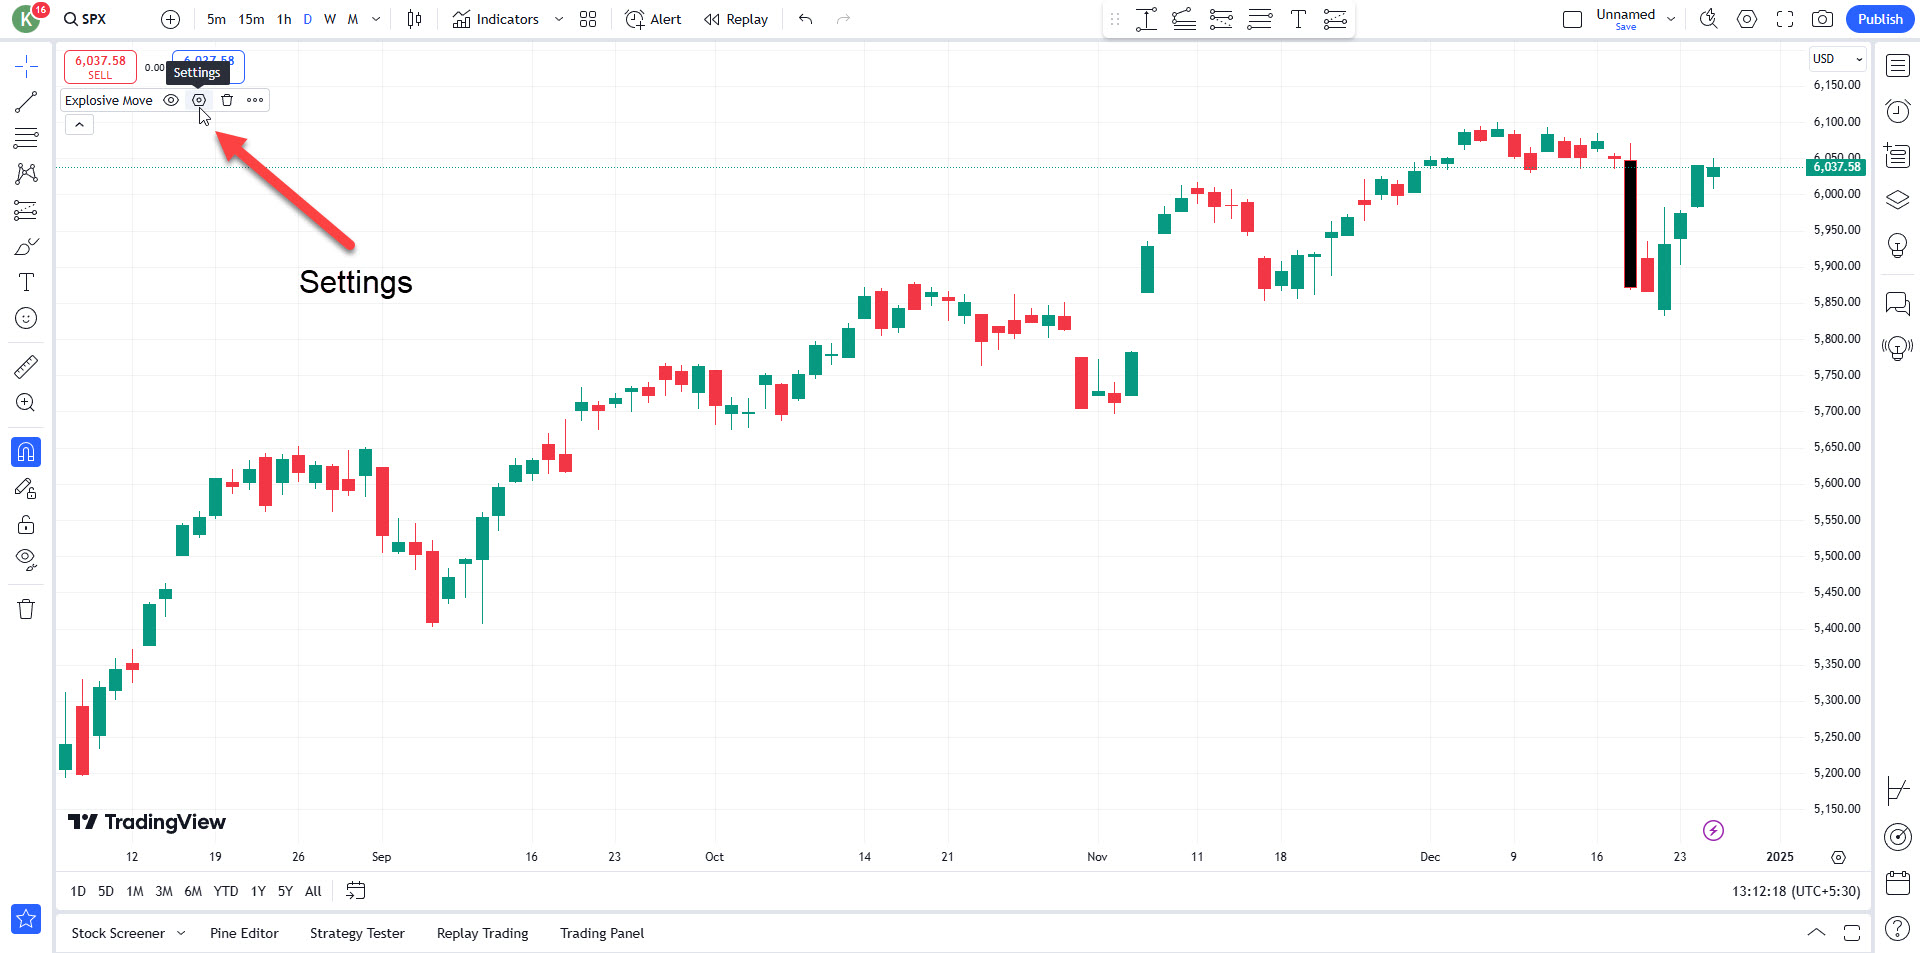
Step 4: Customize and Use the Indicator
- The Explosive Move Indicator will now be visible on your chart.
- To adjust its settings, click the gear icon next to the indicator in your chart’s indicator list.
- Analyze the charts and use it as part of your trading strategy.
Legal Disclaimer
All products, indicators, tools, strategies, scanners, content, and services provided by SurjeetKakkar.com are strictly for educational and informational purposes only. They are intended solely as technical analysis and decision-support tools and do not constitute investment advice, trading advice, portfolio management services, or a recommendation to buy or sell any securities, stocks, indices, commodities, forex, crypto, or any other financial instruments.
SurjeetKakkar.com is NOT a SEBI Registered Investment Advisor (RIA) or SEBI Registered Research Analyst (RA). We do not provide any personalized trading advice, stock tips, buy/sell signals, target-stoploss recommendations, or guaranteed/assured returns in any form.
Trading and investing in financial markets involve significant risk, including the risk of partial or complete loss of capital. Past performance is not indicative of future results. No strategy, indicator, or system can guarantee profits.
All users are solely responsible for their own trading and investment decisions. You are strongly advised to consult with a qualified and SEBI-registered financial advisor before making any financial decisions.
By using any product or service from SurjeetKakkar.com, you acknowledge and agree that:
You fully understand the risks involved in trading
You are using all tools and information at your own discretion and risk
SurjeetKakkar.com and its owner shall not be held liable for any losses, damages, legal issues, or financial consequences arising from the use of any product, tool, content, or service
Trading involves substantial risk, including the potential loss of capital. Past performance is not indicative of future results. Users are solely responsible for their trading decisions and are strongly encouraged to consult with a licensed financial advisor before making any trading or investment decisions.
By using the Indicator, you acknowledge this disclaimer and agree to use the tool responsibly and at your own discretion.